The results are in! After an exciting election period, let’s do some recap on the results and reflect on the predictions I made two weeks ago.
Recap
The congressional elections were a very close call in both the senate and the house. The Democratic candidates performed better than expected and the Republican candidates under performed. The result is that the democrats secured a majority in the Senate with 50 confirmed seats and the presidency while Republicans have 49 confirmed seats. The outstanding seat belongs to Georgia which is going to a runoff election on December 6th. The House of Representatives is now in a Republican majority with a confirmed 220 seats having flipped 18 seats. The democrats have 212 seats only flipping 6 seats from last cycle. Below is a plot of the results (on a slightly outdated map. For better results see https://www.reuters.com/graphics/USA-ELECTION/RESULTS/dwvkdgzdqpm/)

Model Reflection
At a high level, my prediction was biased too strongly in favor of Republican candidates. The overall district level accuracy of my model was 355 correct predictions and 80 incorrect predictions. I am definitely not the only forecaster out there who thought there would be a stronger red wave given the low presidential approval ratings and low economic figures during the term of President Biden. Looking more closely at the details will elucidate what aspects of my model may have lead to this error. My model is actually a series of 435 district models each fitted to its specific historical data. The independent variables in each regression are:
Unemployment rate: The economic predictor with the best r-squared for my data. The theoretical motivation is as described in week 2 that unemployment is a democratic party issue and would favor democrat candidates regardless of incumbency.
Seat incumbency: Candidates running for re-election have a massive advantage in name recognition and fundraising. This variable captures that advantage as two binary indicators.
Presidential party incumbency: Midterm election are often used by voters as a way to reward or punish the performance of the incumbent president.
Presidential approval: The presidential party variable and the presidential approval are in the regression as interaction terms so that the theory of reward and punishment can manifest if the trend exists in the data.
Expert prediction: To have historical expert prediction to model on, I used the Cook Report district ratings and averaged them with the Inside Politics ratings. Experts often have key insights investigating battleground districts so if they have a history of success their 2022 predictions should shine in my models.
Accuracy Reflection
A visualization of my model results looks like this:
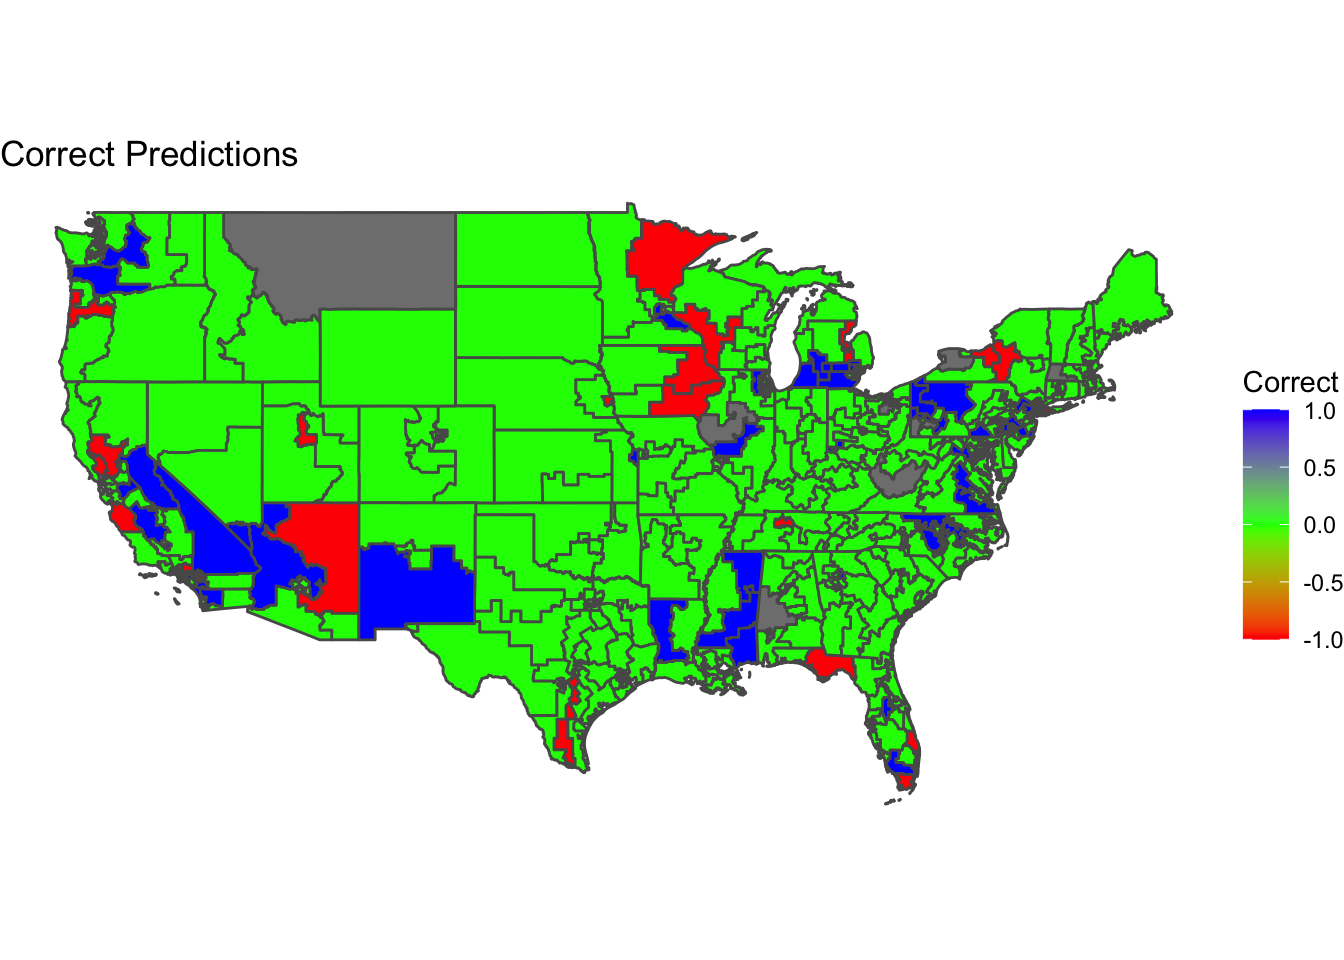 The districts colored in green were correctly characterized by the model while districts in red and blue were incorrect. Red means that the model predicted a Democratic candidate to win but a Republican won instead and blue means that the model predicted a Republican candidate to win but a Democrat won instead.
My models were most often accurate in the Central United States in areas like Texas, Oklahoma, Colorado. This is because these areas are solidly Republican on most years and so the model had a strong history of consistent outcomes to train on. This might also be a result that Republican leaning bias might inadvertently make my predictions seem accurate in states that solidly vote Republican. I also had some good predictions outside the central region in states like Georgia, Alabama and solidly Democrat states in the North East like Massachusetts, New Hampshire, and Maine. On the other hand, contested battleground regions had higher miss rates in my predictions. States like Florida, California, and Arizona had several mispredicted districts.
Looking at the model design, I suspect is that my independent variables of presidential incumbency and approval rating skewed my results against the Democratic party in a way that is no longer a present force in modern elections. I based my choice on the theory taught in academics that presidential approval and seat change for the presidents party are strongly correlated. The mechanism is that people reward or punish the party in midterm elections by judging the performance of the president. The interaction term in my regression between presidential party incumbency and approval rating was not as important as I expected in this election however.
This is possibly due to what Lynn Vavreck called “calcification” or the idea that party identity matters more than something like presidential approval. In other words, voters are no longer holding referenda on the president during midterm elections and are instead so divided on the issues that Republican and Democrat candidates disagree on that their vote is decided by ideological default. This would also explain why economic fundemental variables were unprecedentedly poor predictors of this election outcome. The unemployment variable in my models would then be just as problematic to its predictive accuracy.
Improvement
If I were to approach this task again I would drop the unemployment, presidential incumbency, and presidential approval variables. I would swap in variables that are closer measures of a voter’s sentiment like campaign and candidate quality leading to voter turnout, and stances on ideological issues. Given accurate enough data on these variables would allow for better observation of the newest trends towards partisanship in modern politics where I believe turnout and ideology matter more than fundementals.
Another way to improve prediction is to use the most recent polls which are, for obvious reasons a great way to predict a result because they are by definition a sample of the end result. However I am not in favor of using polls because I don’t think they offer any insights. I would rather choose an independent variable that has a theoretical motivation to be related to a person’s vote rather than just asking them who they are going to vote for because we can therefore learn more about the world and about how democracy works. So, if my model provides a better learning opportunity at the expense of accuracy, I am willing to make concessions.
In contrast to polls, I would be interested in testing out further the ideological voting idea. Using data on a voter’s stance on issues, issue salience/recency, and data about candidates and the campaigns they run, I think a model could more accurately predict an election’s outcome. At the very least, the research would surely further our understanding of what motivates voters in elections.