Welcome back to the last blog post before I make a final prediction on the 2022 midterm elections. The focus of this week’s post is on voting shocks. A shock is a political or apolitical event that influences a voter’s state of mind. Identifying a potential shock must be followed with some reasoning about how the public responds to that kind of event and then theorize about how which direction voters will move on average between candidates. Useful heuristics to make this theorization easier are incumbency and party ideology heuristics. To judge the valence of a shock we can just consider whether it will make most voters more or less favorable for an incumbent or a party and then adjust our expectations according to those data. Bagues and Volvart (2016) use this approach when talking about how an apolitical shock like winning a lottery will increase the favorability of incumbent candidates. This kind of analysis is replicated by Achen and Bartels (2017) who instead observe that a surge in shark attacks will reduce the favorability of incumbents. The unifying conclusion is that events that make people happy will encourage the average voter to support the incumbent candidate in an upcoming election and negative events will hurt incumbent re-election. While Achen and Bartels see this as an instance of purely irrational voting behavior, emotionally motivated voting is not necessarily misguided depending on the nature of the shock. An effective representative should be able to minimize the odds of negative events and increase the odds of positive events.
Shock: Affirmative Action in the Supreme Court
Looking at the upcoming election, I decided to measure the impact of the Supreme Court rulings on affirmative action for college admissions. I chose this topic because it is similar to the Dobbs case in the sense that it is also a judicial ruling, and because it is related to this very blog which is for a Harvard class. To measure the salience of affirmative action as a shock, I used the NYT article API to create the following weekly frequency graph.
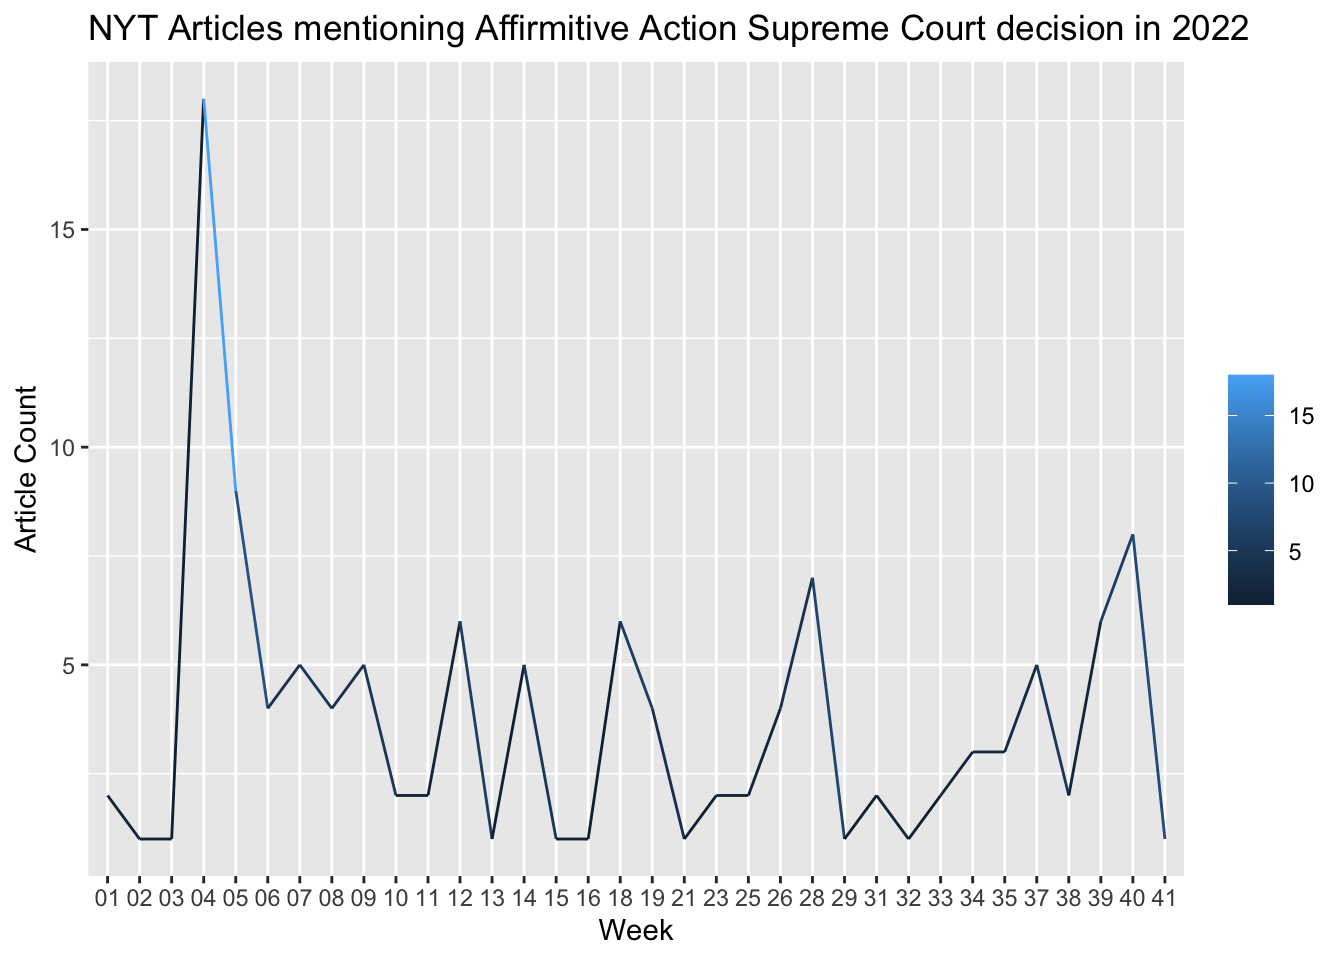
Each week combines the number of articles that mention the keywords affirmative and action. You can tell that in the beginning of the year, the topic had a spike in discussion which has since died does with small peaks every month or so. For midterm election purposes, according to this graph, the topic is not recent or “shocky” enough to have any macro impact on the election outcomes.
Ongoing prediction model
Returning to our running model from previous weeks, I want to take a different approach this week. I have recently been struggling to get powerful predictive results with district level results due to sparse data and rank deficient fits. One way to try and shake things up is to use a pooled model. This means that instead of trying unsuccessfully to make 435 unique models, we can just make one model and run demographics through the model so that predictions still clock on the district level. This will result in districts with similar demographic data having correlated outcomes. Fundementally the assumption in play is that this election will largely be based on voters voting on party lines. Demographics have historically been tightly bound to party afiliation and so the pooled model makes sense to use in this situation.
This weeks model will use. Candidate and presidential party incumbency, recent generic ballot polls, demographic data on race, ethnicity, and sex. The regression table looks like this:
Alas, the model is still not quite right. Its final prediction anticipates that republicans will win 324 seats against 110 for Democrats. This prediction is too heavily skewed in favor of Republican candidates. Perhaps one reason for this is a shortcoming of the pooled model. I can see that all demographic variables have positive coefficients which is not logical given well documented trends that black voters tend to vote for Democratic candidates. Going into my final prediction on Nov. 7th, I plan to address this issue and make qualify uncertainty with a probabilistic model.
References
Christopher H Achen and Larry M Bartels. Democracy for Realists: Why Elections Do Not Produce Responsive Government, volume 4. Princeton University Press, 2017