This week we will be adding an incumbency term to our 2022 House elections prediction model and bringing our predictions into the district level. First however, let’s do an analysis of expert predictions. An expert prediction is when a journalist of political pundit make personal predictions about how certain contentious districts will break in the upcoming election. The person or firm informs their decision with their unique knowledge and expertise about the voters and candidates. The prediction takes the form of a 7 option likert scale from “solid”, “likely”, and “lean” towards one party or the other or “Toss Up” if they think the election is too close to make a verdict. The benefit of expert predictions is that, theoretically, expert predictions are already based on solid data collected and considered by each expert and so they are a very easy shortcut to making our own predictions. The major drawback of expert predictions is that they are also packed with the biases of the expert and often tend to be more opinionated than calculated. In the first part of this post lets examine historical expert predictions and see how accurate they were compared to the election results.
How Expert are the Experts 2018 Edition
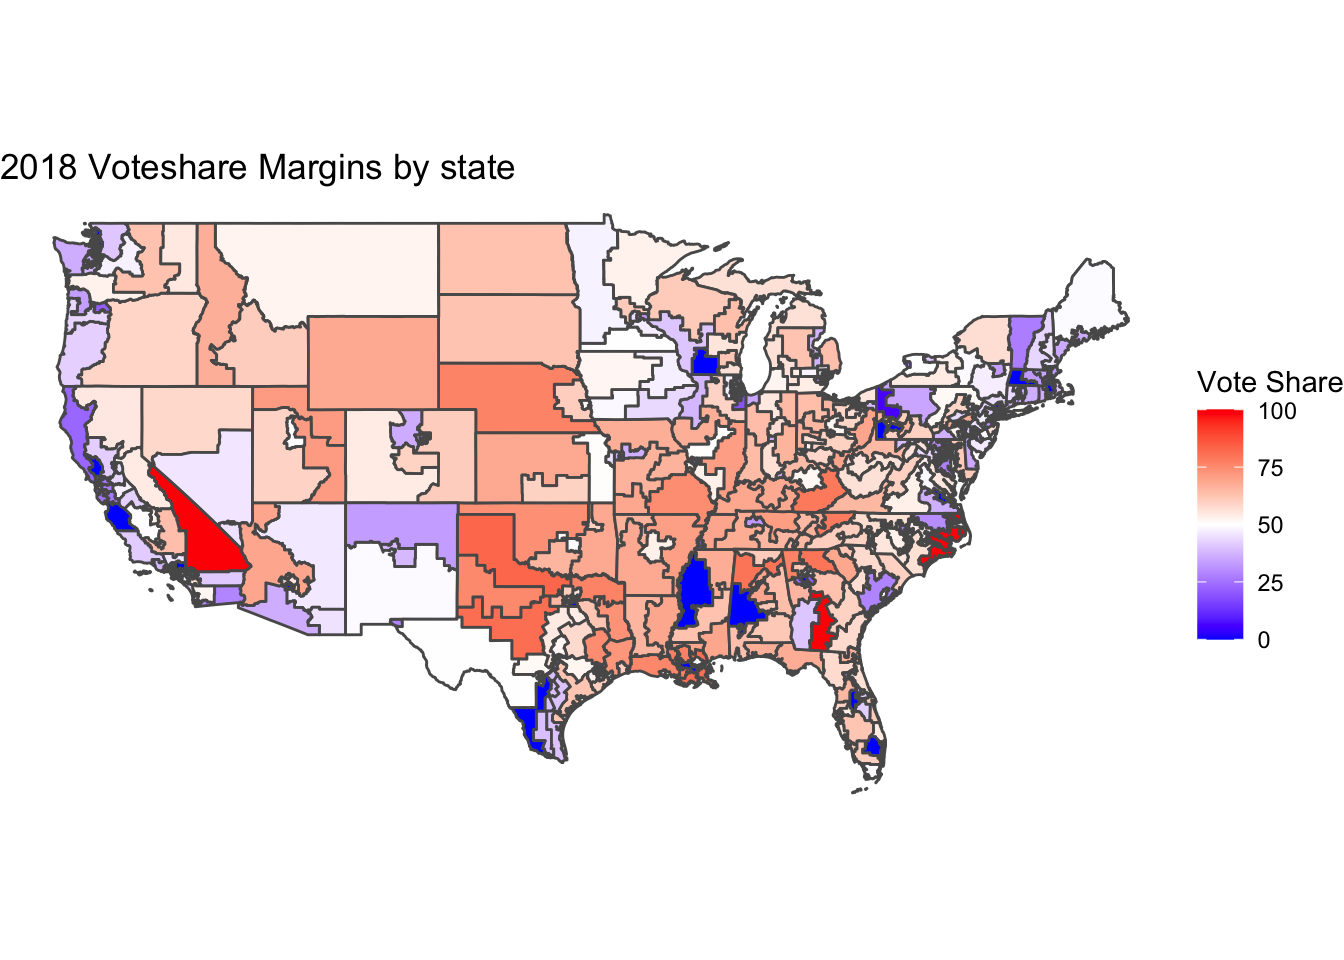
The method of testing expert prediction accuracy is to look at the district level and compare the election outcome to the average expert prediction. Up first is a plot of all mainland districts colored in red for higher two party vote share for Republicans, and blue for a higher vote share for Democrats. Districts in white had close elections.
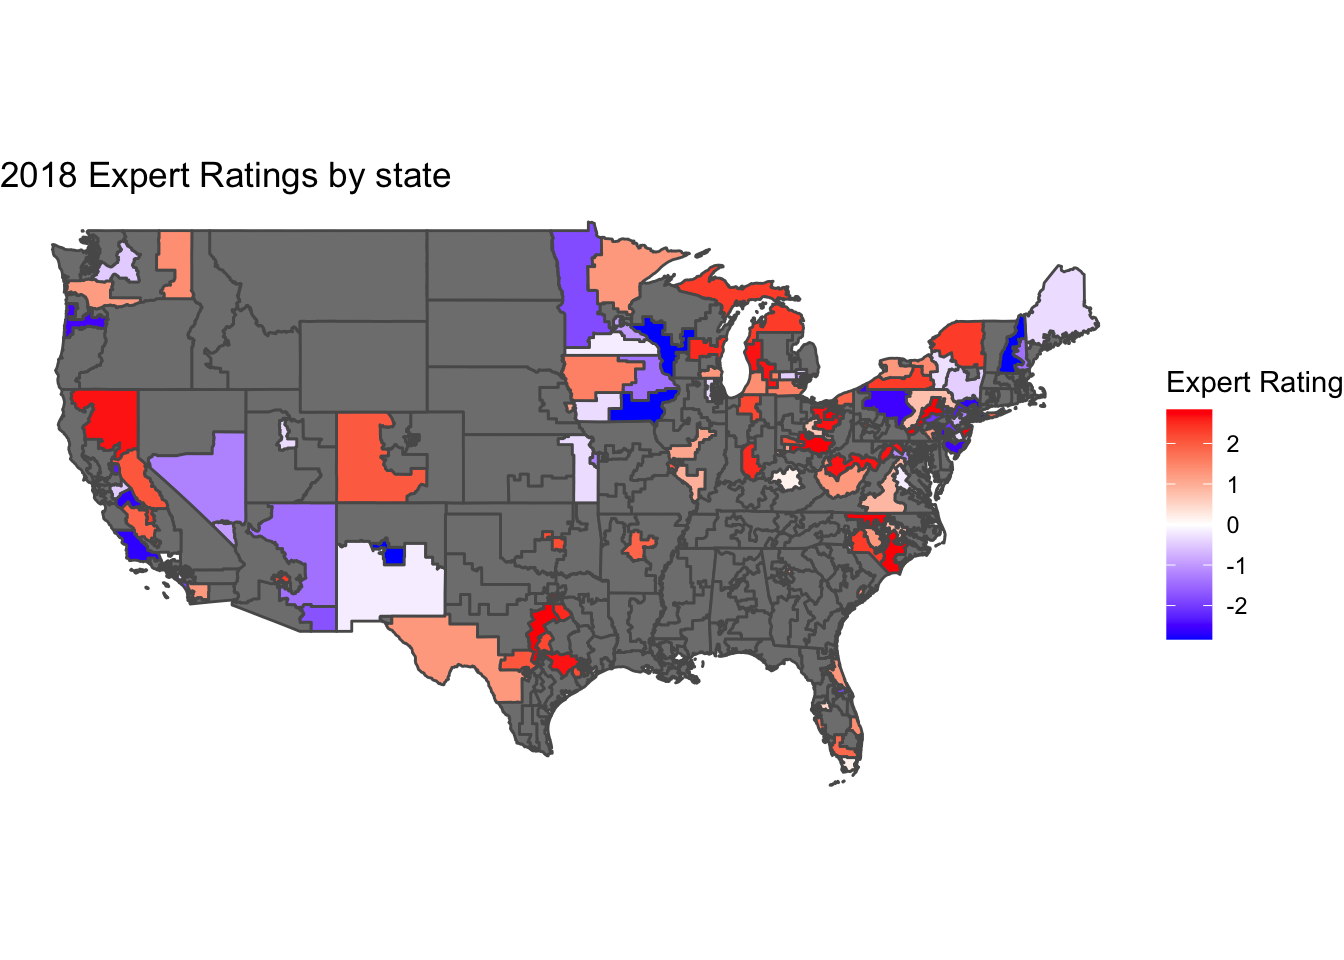
Next up are the expert predictions following a similar structure but with a 7 point scale. In this visualization a 3 is the highest likelihood of Republican victory and a -3 is the highest likelihood of Democrat victory. States in grey lacked a prediction from any of the expert predictions. This is perhaps because every expert believed the outcome was not close enough to merit attention.
Overlaying the two maps and showing the absolute difference between prediction and result yields the following combined graph. In this graph a low value of 0 means perfect accuracy and a high value means low accuracy.

In order to make this comparison I decided to convert the vote share outcomes into a 1-7 scale using a tiered bucket system that focused on a vote share margin or up to 6 percent. I clipped off large margins at 6% because I wanted to have the extremes of expert prediction scores be considered accurate for any margin above 6 percentage points and focus on predictions that lay in the middle in margins of 4 percentage points. We can notice in the graph that most average expert predictions are high accuracy and within 2 percentage points of the outcome on average. Geographically, experts seem to be better at predicting northern districts and worse with southern districts such as the Texas, Florida and Oklahoma examples above.
Incumbency
There are a couple axes of incumbency to explore. First is the idea of reelection and the other is about party affiliation. The motivation behind using incumbency on the individual level is that candidates running for re-election have the advantage of greater visibility in their district. One complication about a simply incumbency variable is presented in research by Adam Brown in the Journal of Experimental Political Science. Brown argues that inherent incumbency does not matter to voters in elections but that other factors that correlate with incumbency such as fundraising and candidate quality do matter. So in this model, think of incumbency as the simplest heuristic for candidate quality and visibility to voters. The model also fators in presidential party incumbency which
The incumbency predictions forecast a large lead 252:183 seats for Republican candidates. The regression coefficients indicate that the negative correlation caused by a Democratic presidential position outweighed the majority of Democrat incumbents. As expected, being a challenger had a negative correlation with voteshare in almost all districts while running for reelection had a positive forecast coefficient. I intend to reintegrate fundamentals back into the district level model in future iterations of this prediction.
References
Adam R. Brown. Voters Don’t Care Much About Incumbency. Journal of Experimental Political Science, 1(2):132–143, 2014.