Welcome back to my election analytics blog. This week we will be looking at economic data as predictors for the popular vote. Political science theory described by Achen and Bartels in Democracy for Realists suggests that voter behavior can be modeled retrospectively. When a voter chooses who to vote for, they measure the performance of the incumbent party based on their experiences during the last term when they decide to keep or replace the party candidate. A large factor influencing the experiences of a voter is their economic prosperity. When a voter benefits from increases in purchasing power during the term of some representative, they are very likely to keep that party in power. Likewise, economic deterioration is likely to see the incumbent punished and voted out.
This blog will focus in on local economic data because it is my hypothesis that if retrospective voting behavior surrounding the economy will influence the 2022 elections, a voter’s local economic condition will be more salient an issue to them than national averages. The national and local data is collected from past midterm elections and quarterly unemployment reports from the Bureau of Labor Statistics. We will compare the predictive power of national and local data using models created on historical unemployment data.
The National Model
Let’s begin by looking at national averages of unemployment and midterm two-party vote share for midterm election years going back to 1978. For example, here is a peek into the underlying data table at play:
##  year RepVotes DemVotes RepVoteMargin unemployment_rate
##  1978 24891165 29517656         0.457              6.23
##  1982 27796580 35516107         0.439              9.23
##  1986 26599585 32625513         0.449              6.93
##  1990 28026690 32942345         0.460              5.43
##  1994 37099921 32122004         0.536              6.37
##  1998 32254557 31465334         0.506              4.47
##  2002 37405702 33811240         0.525              5.80
##  2006 35944748 42278903         0.460              4.70
##  2010 43288427 37663261         0.535              9.70
##  2014 39850411 35469234         0.529              6.33
##  2018 51017329 60576466         0.457              3.97
Putting this data into a graph we get the following plot:
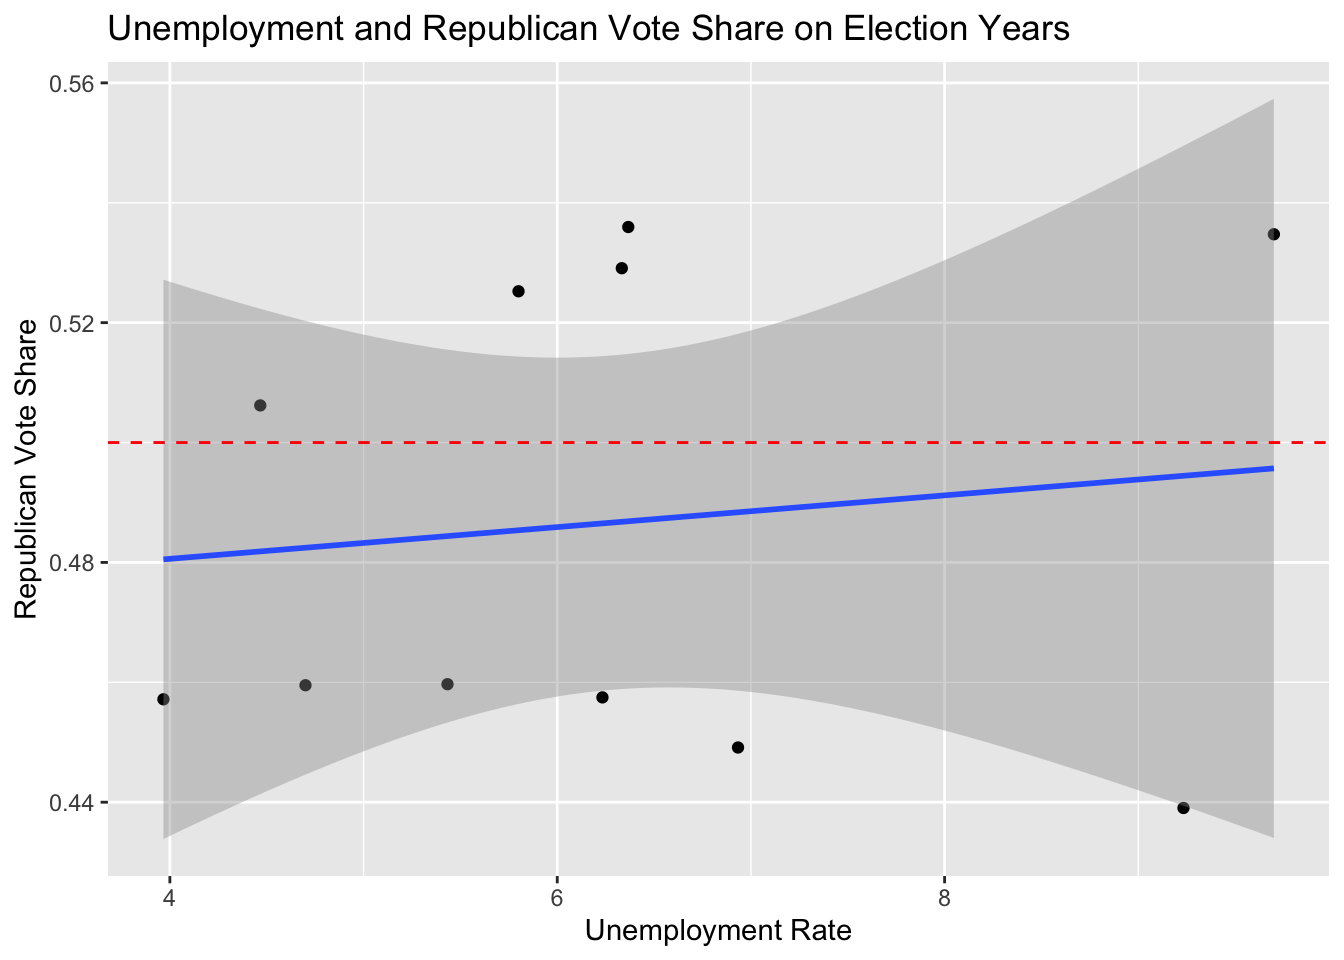
A point on this plot represents one row of the data table above. The red dotted line represents the equal vote share level while the blue solid line attempts to fit the trend of the data. Evidently, with so few points and such high variability, the model does not have strong predictive power. It has an R squared value of 0.015. Nonetheless, extrapolating the republican vote share for a current national unemployment rate of 3.8% yields a Republican popular vote share of 0.48 or 48%.
The Local Model
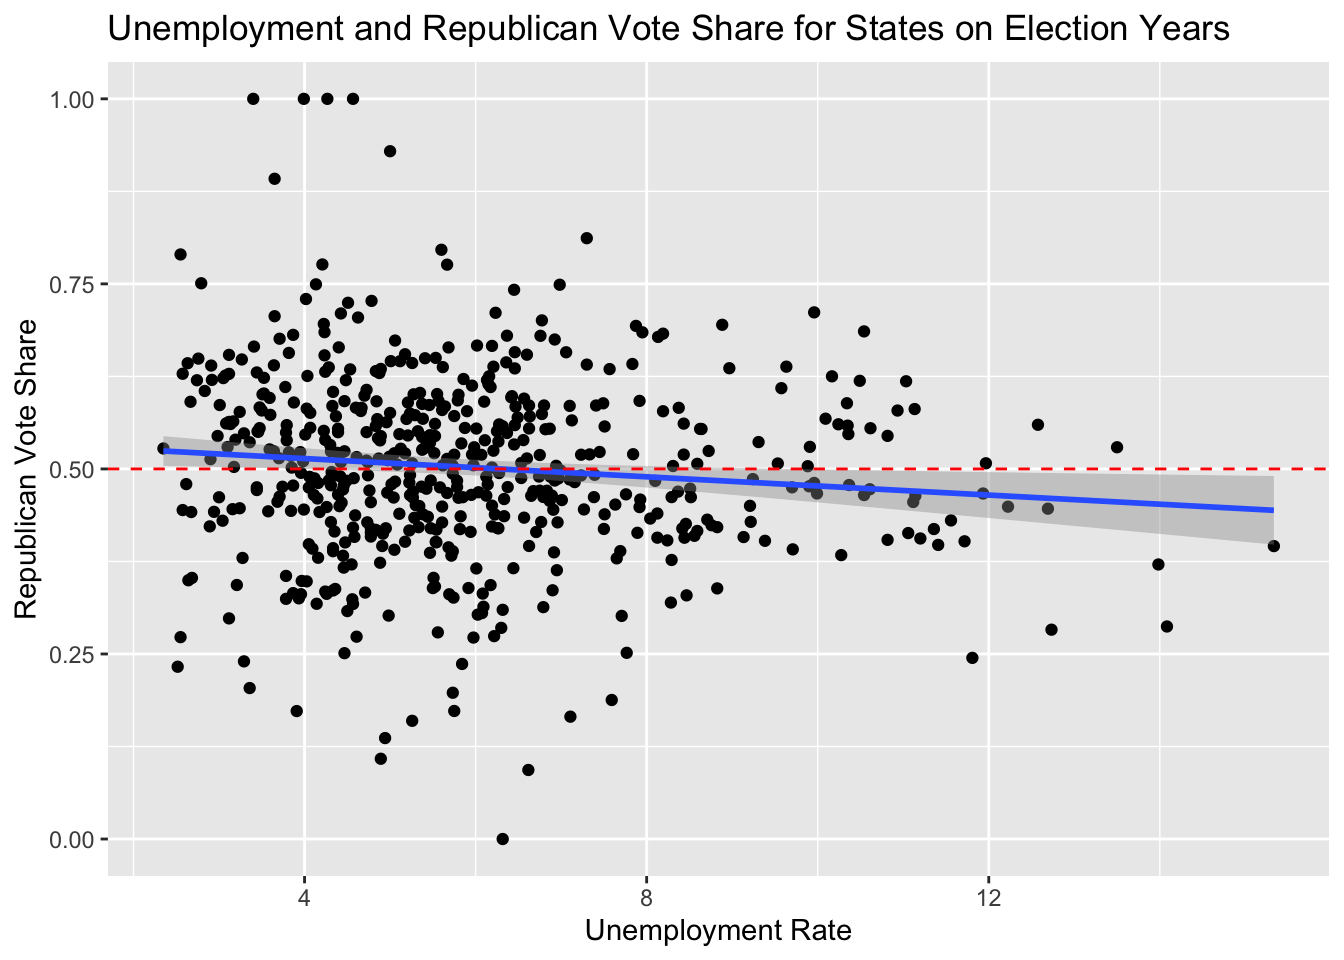 This chart gives a rough visualization of all data points from 1978 to 2018 for all midterm election years combined. Each dot represents data from one state on a certain election year. The midline of 50 percent vote share is marked in red. A result above the line means that the state’s districts were likely won by the Republican candidate and a result below the line similarly favors the Democratic candidate. The linear trend that the data follows is that on average, low unemployment on election years (2-6%) favors the Republican party and higher unemployment favors the platform of the Democratic Party (6+%).
To make a predictive model from this, we will differentiate between states and weight by their population. We use state specific unemployment data on each election years to fit a line for each state. We can then take that state’s current unemployment rate to calculate the predicted 2022 Republican vote share in that state. To weight the values by population, we multiply each prediction by the current state population and divide by the national population. The sum of the remaining predictions is the new population adjusted national republican popular vote share. Following this procedure, the model predicts that Republicans will receive 49% of the popular vote. This is a difference of only 1 percentage point from the simple national model prediction. The R squared values for each state prediction though was on average 9 times greater than the national model but still a relatively small value of 0.092. I expect, however, that with more election cycles to use as data, the predictive power would increase.
According to retrospective voting, this model predicts that economic performance as measured by current unemployment rates gives a small advantage to the Democratic party in national popular vote. The effect is very small though which fits with the analysis of John Wright in 2012. According to Wright, when Democrats are incumbents, they are not punished nor rewarded by decreasing or increasing unemployment levels as much as Republican incumbents. Since the Democratic party is the majority of incumbent candidates this election, I would not be surprised for this result to remain true according to this blog’s analysis.
References
Christopher H Achen and Larry M Bartels. Democracy for Realists: Why Elections Do Not Produce Responsive Government, volume 4. Princeton University Press, 2017.
John R Wright. Unemployment and the democratic electoral advantage. American Political Science Review, 106(4):685–702, 2012. ISSN 0003-0554.